アプリの使い方
ドライブを開く

新規


これをインストール

起動

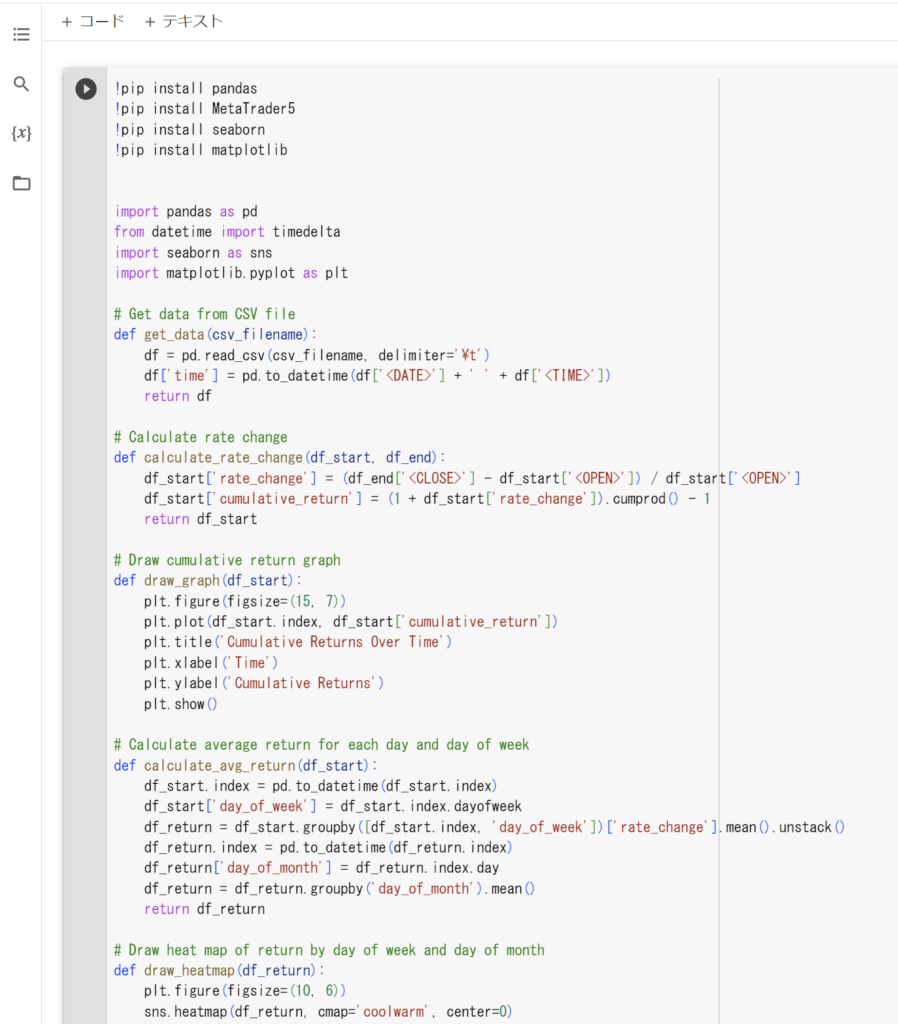
以下をコピーする

|
1 2 3 4 5 6 7 8 9 10 11 12 13 14 15 16 17 18 19 20 21 22 23 24 25 26 27 28 29 30 31 32 33 34 35 36 37 38 39 40 41 42 43 44 45 46 47 48 49 50 51 52 53 54 55 56 57 58 59 60 61 62 63 64 65 66 67 68 69 70 71 72 73 74 75 76 77 78 79 80 81 82 83 |
!pip install pandas !pip install seaborn !pip install matplotlib import pandas as pd from datetime import timedelta import seaborn as sns import matplotlib.pyplot as plt # Get data from CSV file def get_data(csv_filename): df = pd.read_csv(csv_filename, delimiter='\t') df['time'] = pd.to_datetime(df['<DATE>'] + ' ' + df['<TIME>']) df['time'] = df['time'] + timedelta(hours=9) # タイムゾーンを+9時間する return df # Calculate rate change def calculate_rate_change(df_start, df_end): df_start['rate_change'] = (df_end['<CLOSE>'] - df_start['<OPEN>']) / df_start['<OPEN>'] df_start['cumulative_return'] = (1 + df_start['rate_change']).cumprod() - 1 return df_start # Draw cumulative return graph def draw_graph(df_start): plt.figure(figsize=(15, 7)) plt.plot(df_start.index, df_start['cumulative_return']) plt.title('Cumulative Returns Over Time') plt.xlabel('Time') plt.ylabel('Cumulative Returns') plt.show() # Calculate average return for each day and day of week def calculate_avg_return(df_start): df_start.index = pd.to_datetime(df_start.index) df_start['day_of_week'] = df_start.index.dayofweek df_return = df_start.groupby([df_start.index, 'day_of_week'])['rate_change'].mean().unstack() df_return.index = pd.to_datetime(df_return.index) df_return['day_of_month'] = df_return.index.day df_return = df_return.groupby('day_of_month').mean() return df_return # Draw heat map of return by day of week and day of month def draw_heatmap(df_return): plt.figure(figsize=(10, 6)) sns.heatmap(df_return, cmap='coolwarm', center=0) plt.title('Return by Day of Month and Day of Week') plt.xlabel('Day of Week') plt.ylabel('Day of Month') plt.xticks(ticks=range(7), labels=['Monday', 'Tuesday', 'Wednesday', 'Thursday', 'Friday', 'Saturday', 'Sunday']) plt.show() # Calculate hourly change rate def calculate_hourly_change_rate(df): df['prev_close'] = df['<CLOSE>'].shift(12) df['hourly_change_rate'] = (df['<CLOSE>'] - df['prev_close']) / df['prev_close'] * 100 df.dropna(inplace=True) return df # Draw heatmap of hourly price change rate def draw_heatmap_hourly_change_rate(df): heatmap_data = df.pivot_table(index=df['time'].dt.hour, columns=df['time'].dt.day, values='hourly_change_rate') plt.figure(figsize=(10, 6)) sns.heatmap(heatmap_data, cmap='RdYlGn', cbar=False, annot=False) plt.title('Hourly Price Change Rate Heatmap') plt.xlabel('Day') plt.ylabel('Hour') plt.show() csv_filename = 'mt5_data.csv' # CSV file to read data from df = get_data(csv_filename) df_start, df_end = df.groupby(df['time'].dt.date).first(), df.groupby(df['time'].dt.date).last() df_start = calculate_rate_change(df_start, df_end) draw_graph(df_start) df_return = calculate_avg_return(df_start) draw_heatmap(df_return) df = calculate_hourly_change_rate(df) draw_heatmap_hourly_change_rate(df) |

貼り付ける
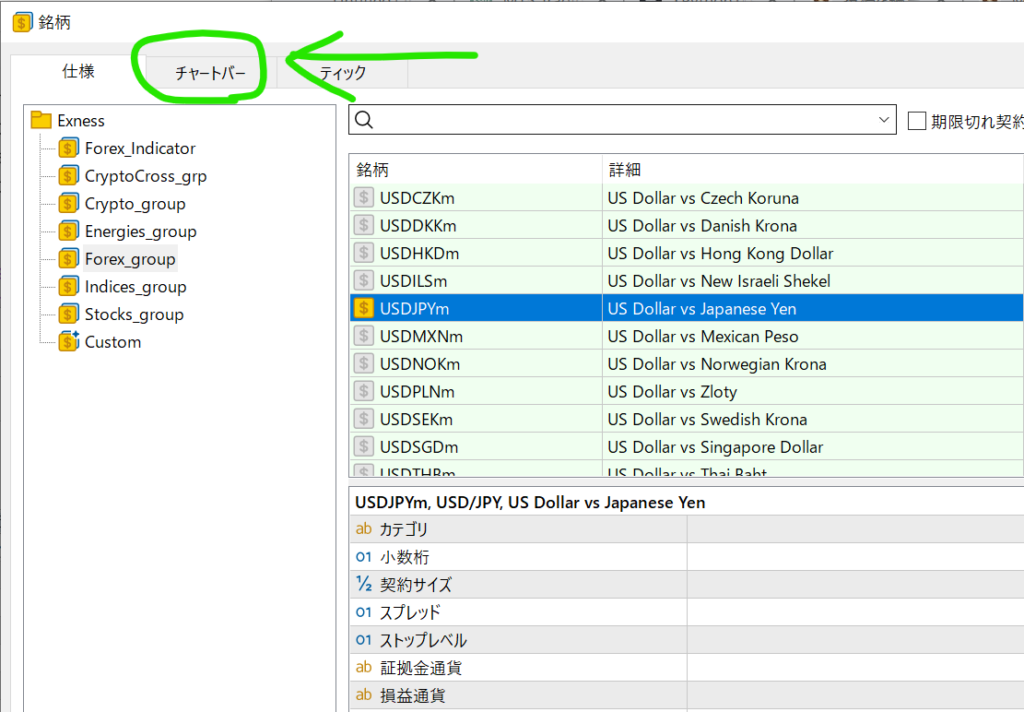
ヒストリカルデータを取りに行く
ヒストリカルデータの入手する


5分足で情報を取得


ファイル名を
|
1 |
mt5_data.csv |
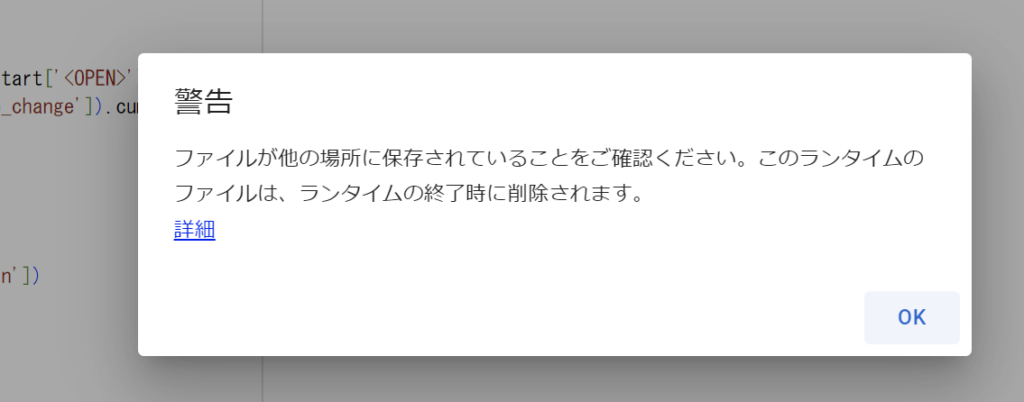
保存する

ファイルから

さっきのファイルを選択


OK

読み込み5秒待つ

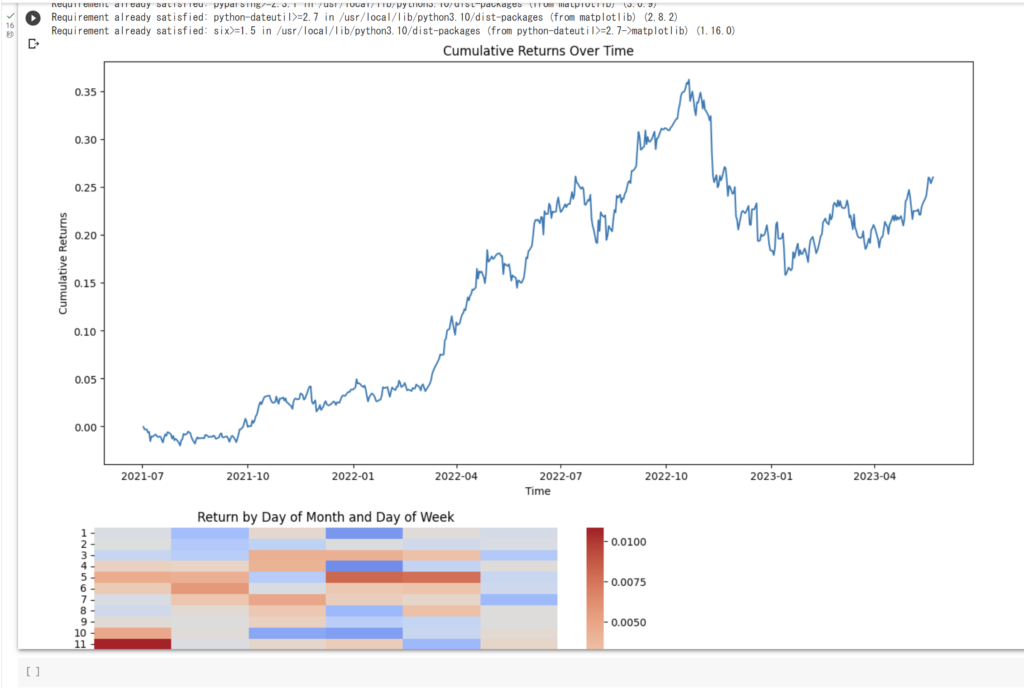
この状態でOK

押すとおわりです。


BybitがGoogleのIPアドレス規制をしているためです。国内のVPSなら使…
自分のbotで使ってるAPIキーを使用しているんですが、 You have br…
pybit 最新版にコードを変更しました。コードとrequirements.tx…
お返事ありがとうございます。はい。pybit==2.3.0になっております。
コードはあっていると思います。rewuirements.txtは「pybit==…