前回Trading Viewのストラテジーを作りました。これをPythonへ書き換えてもらうことできます。
Table of Contents
プロンプト
|
1 2 3 4 5 6 7 8 9 10 11 12 13 14 15 16 17 18 19 20 21 22 23 24 25 26 27 28 29 30 31 32 33 34 |
//@version=5 strategy("RSI Trading Strategy", overlay=true) // Input rsiLength = input.int(title="RSI Length", defval=14, minval=1) overbought = input.int(title="Overbought Level", defval=70, minval=1) oversold = input.int(title="Oversold Level", defval=30, minval=1) // RSI Calculation rsi = ta.rsi(close, rsiLength) // Entry Conditions longCondition = ta.crossover(rsi, overbought) shortCondition = ta.crossunder(rsi, oversold) // Exit Conditions longExitCondition = ta.crossunder(rsi, 40) shortExitCondition = ta.crossover(rsi, 60) // Trading Logic if (longCondition) strategy.entry("Long", strategy.long) if (shortCondition) strategy.entry("Short", strategy.short) if (longExitCondition) strategy.close("Long") if (shortExitCondition) strategy.close("Short") // Plotting plot(rsi, title="RSI", color=color.blue) hline(overbought, title="Overbought", color=color.red, linestyle=hline.style_dashed) hline(oversold, title="Oversold", color=color.green, linestyle=hline.style_dashed) |
これをPythonへ書き換えて
サンプルコード

|
1 2 3 4 5 6 7 8 9 10 11 12 13 14 15 16 17 18 19 20 21 22 23 24 25 26 27 28 29 30 31 32 33 34 35 36 37 38 39 40 41 42 43 44 45 46 47 48 49 50 51 52 53 54 55 56 57 58 |
import talib import numpy as np import pandas as pd import yfinance as yf # Download historical data ticker = "AAPL" data = yf.download(ticker, start="2020-01-01", end="2023-04-29") # Define strategy parameters rsiLength = 14 overbought = 70 oversold = 30 # Calculate RSI data["RSI"] = talib.RSI(data["Close"], rsiLength) # Define entry and exit conditions data["LongCondition"] = np.where(data["RSI"] > overbought, 1, 0) data["ShortCondition"] = np.where(data["RSI"] < oversold, 1, 0) data["LongExitCondition"] = np.where(data["RSI"] < 40, 1, 0) data["ShortExitCondition"] = np.where(data["RSI"] > 60, 1, 0) # Define trading signals data["Signal"] = 0 data.loc[data["LongCondition"] == 1, "Signal"] = 1 data.loc[data["ShortCondition"] == 1, "Signal"] = -1 # Define positions data["Position"] = data["Signal"].shift(1) # Define trade size capital = 100000 risk_pct = 0.02 data["TradeSize"] = np.floor(capital * risk_pct / data["Close"]) # Calculate returns data["StrategyReturns"] = data["TradeSize"] * data["Position"] * (data["Close"] - data["Close"].shift(1)) # Calculate cumulative returns data["CumulativeReturns"] = data["StrategyReturns"].cumsum() # Plot results import matplotlib.pyplot as plt fig, ax = plt.subplots(2, 1, figsize=(10, 8)) ax[0].plot(data["Close"], label="Price") ax[1].plot(data["RSI"], label="RSI") ax[1].axhline(y=overbought, color="red", linestyle="--", label="Overbought") ax[1].axhline(y=oversold, color="green", linestyle="--", label="Oversold") ax[1].legend() ax2 = ax[1].twinx() ax2.plot(data["CumulativeReturns"], color="black", label="Strategy Returns") ax2.legend() plt.show() |

talibのインストールめんどくさいな・・・


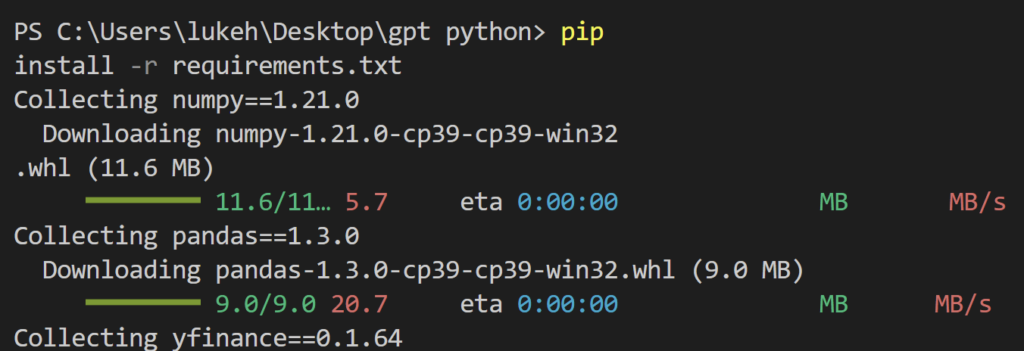
今度はyfinanceがでてこないので


installまで済ませました。

これでヨシ
実行させてみるとバックテストしてくれました。

pandasを使ったサンプルコード
|
1 2 3 4 5 6 7 8 9 10 11 12 13 14 15 16 17 18 19 20 21 22 23 24 25 26 27 28 29 30 31 32 33 34 35 36 37 38 39 40 41 42 43 44 45 46 47 48 49 50 51 52 53 54 55 56 57 58 59 60 61 62 63 |
import numpy as np import pandas as pd import yfinance as yf # Download historical data ticker = "AAPL" data = yf.download(ticker, start="2020-01-01", end="2023-04-29") # Define strategy parameters rsiLength = 14 overbought = 70 oversold = 30 # Calculate RSI delta = data["Close"].diff() gain = delta.where(delta > 0, 0) loss = -delta.where(delta < 0, 0) avg_gain = gain.rolling(window=rsiLength).mean() avg_loss = loss.rolling(window=rsiLength).mean() rs = avg_gain / avg_loss data["RSI"] = 100 - (100 / (1 + rs)) # Define entry and exit conditions data["LongCondition"] = np.where(data["RSI"] > overbought, 1, 0) data["ShortCondition"] = np.where(data["RSI"] < oversold, 1, 0) data["LongExitCondition"] = np.where(data["RSI"] < 40, 1, 0) data["ShortExitCondition"] = np.where(data["RSI"] > 60, 1, 0) # Define trading signals data["Signal"] = 0 data.loc[data["LongCondition"] == 1, "Signal"] = 1 data.loc[data["ShortCondition"] == 1, "Signal"] = -1 # Define positions data["Position"] = data["Signal"].shift(1) # Define trade size capital = 100000 risk_pct = 0.02 data["TradeSize"] = np.floor(capital * risk_pct / data["Close"]) # Calculate returns data["StrategyReturns"] = data["TradeSize"] * data["Position"] * (data["Close"] - data["Close"].shift(1)) # Calculate cumulative returns data["CumulativeReturns"] = data["StrategyReturns"].cumsum() # Plot results import matplotlib.pyplot as plt fig, ax = plt.subplots(2, 1, figsize=(10, 8)) ax[0].plot(data["Close"], label="Price") ax[1].plot(data["RSI"], label="RSI") ax[1].axhline(y=overbought, color="red", linestyle="--", label="Overbought") ax[1].axhline(y=oversold, color="green", linestyle="--", label="Oversold") ax[1].legend() ax2 = ax[1].twinx() ax2.plot(data["CumulativeReturns"], color="black", label="Strategy Returns") ax2.legend() plt.show() |
おわり
ChatGPTを使えばTrading ViewのストラテジーからPythonへ書き換えてみるのは簡単です。


BybitがGoogleのIPアドレス規制をしているためです。国内のVPSなら使…
自分のbotで使ってるAPIキーを使用しているんですが、 You have br…
pybit 最新版にコードを変更しました。コードとrequirements.tx…
お返事ありがとうございます。はい。pybit==2.3.0になっております。
コードはあっていると思います。rewuirements.txtは「pybit==…